v20.1.55.1775 [Jan 22, 2020]
NEW - SENSORS:
- SNMP NUTANIX CLUSTER HEALTH: The new SNMP Nutanix Cluster Health BETA sensor provides an overview of your Nutanix cluster and shows the status of the cluster, as well as several performance metrics. Additionally to the quick status overview where you can see whether the cluster is started or stopped, for example, the new SNMP Nutanix Cluster Health sensors enables you to check I/O operations per second, used I/O bandwidth, and I/O latency with PRTG.
- SNMP NUTANIX HYPERVISOR: The new SNMP Nutanix Hypervisor BETA sensor monitors the health of your Nutanix cluster hypervisors. The sensor shows an overview of hypervisor performance metrics like CPU usage, traffic, and I/O data, as well as the number of active virtual machines on a node.
IMPROVED - SERVER:
- ACCESS RIGHTS: We improved the performance of the access rights check. This will speed up the loading times of objects in PRTG for non-administrative user accounts after the login. In certain cases, loading all objects after the login took quite long for user accounts except for the PRTG system administrator.
- LOGIN: We modernized the password reset approach that consists of receiving a link by email from where you can set your new password.
- PROBE CONNECTIONS: We improved the stability of probe connections to the PRTG server. After performance improvements for probe connections in PRTG version 19.2.50, some customers reported issues with the connection stability in certain scenarios.
IMPROVED - WEBGUI:
- GEO MAPS: If PRTG cannot retrieve data for geo maps when using the Google Maps API because of, for example, a wrong API key or unavailability of the service, PRTG now will show according information in the geo map section and logs to exactly tell you what went wrong.
- REPORTS: We improved the appearance of reports that include data graphs. The height of main and monthly graphs is now consistent in all report templates that include graphs. In previous versions, graphs in "graphs only" report templates were very large, so we reduced their size to be able to display channel averages on the same page and so help you to get as much information as possible at a glance.
- SENSORS: You are now able to directly identify the impact on the PRTG system performance of a running sensor in its general information section. Each sensor shows the performance impact bar that you already know from the Add Sensor page on its overview tab, live data tab, and data by days tabs. This information will help you to easier decide about what sensor types to use and which scanning intervals to configure to get the best PRTG system performance possible.
IMPROVED - SECURITY:
- LOGIN: We improved the handling of user sessions.
- WEBGUI: We fixed a potential XSS vulnerability of the PRTG web interface.
- WEB SERVER: This PRTG version comes with a more strict web server security by default to keep PRTG as secure as possible. TLS 1.2 will be the new default web server connection security.
CHANGED - SENSORS:
- PYTHON SCRIPT ADVANCED: This PRTG version includes a new Python distribution because of the end-of-life announcement for Python 3.4. Please make sure that your custom Python scripts are compatible with Python 3.7 when you update PRTG.
- REST CUSTOM (SIGFOX): We adjusted the default Sigfox templates for the REST Custom sensor to adapt the Sigfox v2 API. With this change we also combined the device state template (sigfox.device.template) and the token state template (sigfox.device.token.template) into one new template with different channels. Also, required lookup files are available again.
- WMI DISK HEALTH AND WMI STORAGE POOL: We implemented some cosmetic improvements for the beta sensors WMI Disk Health and WMI Storage Pool that we newly introduced in the last PRTG version 19.4.54.
CHANGED - GEO MAPS
- PROVIDERS: We removed the deprecated geographical map service provider CloudMade from PRTG. You cannot choose this provider anymore in section Geo Maps of the user interface settings in the PRTG system administration. If you had selected CloudMade before your PRTG update, the provider setting will be automatically changed to default.
FIXED - SENSORS:
- EXE/SCRIPT SENSORS: We fixed an issue with encrypting passwords that contain certain special characters like the dollar sign ($). The issue affected EXE/Script and EXE/Script Advanced sensors. The dollar sign, for example, broke the encryption method, which resulted in a password being partly visible as clear text in the sensor log when you enabled the option Write EXE result to disk and used according placeholders in the parameters field.
- MQTT ROUND TRIP: - The Client Key Password of the MQTT Round Trip BETA sensor is now masked in the sensor log that is written when you enable the option Write sensor result to disk.
v19.2.50.2842 [Apr 10, 2019]
- MQTT ROUND TRIP: This PRTG version comes with the new MQTT Round Trip sensor! You can now monitor the availability of an MQTT broker to ensure your IoT devices can deliver their data at all times. Use the MQTT Round Trip sensor to check if a connection to the broker can be established, if the broker accepts messages via publish, if the broker forwards a message to a matching subscriber, and measure either the connection times or the round trip time from publishing a message until receiving it back on a subscribed topic.
- DHCP: You can now monitor multiple DHCP servers in different networks. The DHCP sensor will send the data packets only via the selected NIC to monitor the DHCP server. If there is no DHCP server available in the specified network, for example, if the NIC has a link-local address, the sensor will time out as expected.
- FTP SERVER FILE COUNT: The FTP Server File Count sensor now supports TLS 1.2 connections.
- ORACLE SQL: We updated the Oracle library that Oracle SQL v2 and Oracle Tablespace sensors use to monitor your Oracle databases. We have seen that both sensor types cause less CPU load on the PRTG probe system compared to previous versions when using the updated library.
- VMWARE HOST HARDWARE STATUS (SOAP): You can now define Known Warnings and Known Errors in the settings of the VMware Host Hardware Status (SOAP) sensor that include angle brackets () to ignore messages that include such characters.
- VMWARE HOST PERFORMANCE AND VMWARE VIRTUAL MACHINE (SOAP): The sensor types VMware Host Performance (SOAP) and VMware Virtual Machine (SOAP) can now inherit the Channel Unit Configuration settings from the parent device. Please note that this still is not possible for certain units like bandwidth, for example.
- WINDOWS IIS APPLICATION: We added two new channels to the Windows IIS Application sensor. The channels show status and system uptime of a monitored web service. If the web service is not available, the sensor will show a down status.
- AMAZON SNS NOTIFICATIONS: The Location setting of the notification method Send Amazon Simple Notification Service Message now shows all available SNS locations in a dropdown list instead of a bullet list for a better usage of the available space.
- EXECUTE PROGRAM: Notifications that execute programs now show a meaningful message in notification related logs instead of an access violation if the defined credentials are incorrect.
- NOTIFICATION TEMPLATES: On the Notification Templates tab in your account settings, you can now directly test an existing template, pause or resume it, and open a list of objects that use the template. The functionalities are accessible in the notification templates table without the need of using the multi-edit menu.
- NOTIFICATION TRIGGERS: Notification templates that you select for a notification trigger now show the actions they perform with an according icon in the dropdown before the template name.
- SMS NOTIFICATIONS Ampersands (&) are now correctly URL-encoded (%26) in SMS notifications even if you use a custom URL for SMS delivery. In previous versions, the encoding was missing in this case so that the notification messages were truncated to everything before the ampersand.
- MULTI-EDIT: You can now acknowledge one or more down states on the Alarms tab of the root group, of a group, and of a device using the multi-edit menu.
- REPORTS: We changed the rendering engine for PDF reports. PRTG now uses Chromium instead of the deprecated PhantomJS to be able to generate PDF reports in a more reliable way. Screenshots that you generate for the support bundle also use Chromium now.
- Known issue: Please ensure port 9222 is not blocked on the PRTG core server system to generate PDF reports and screenshots. This only affects PRTG version 19.2.50.
- TAGS: Clicking a tag in the settings of a Notification Template or Map now opens a list with all accordingly tagged objects.
- CLUSTER: We slightly improved the cluster performance.
- PROBE CONNECTIONS: We slightly improved the performance of probe connections by introducing a threadpool instead of using two dedicated threads for each probe. You will especially notice the improvement if you have many remote probes connected.
- PACKET SNIFFER: Packet Sniffer and Packet Sniffer (Custom) sensors now use the Npcap library instead of the deprecated WinPcap to monitor your traffic.
- Note: If you need to downgrade from PRTG 19.2.50 or later to a PRTG version 19.2.49 or previous for some reason, please first stop the PRTG services and manually uninstall Npcap before you install an older PRTG version.
- LOOPBACK ADAPTER: PRTG now installs a loopback adapter as part of the Npcap library for Packet Sniffer sensors.
v18.4.47.1962 [Oct 18, 2018]
WebGUI
- Notifications:
- You can now see all defined notification methods in your PRTG user account settings at a glance. The Notification Templates overview table has a new column that shows the Actions a notification template will perform when it is triggered.
- You can now use a search field to filter for existing notification templates when you add or edit a Notification Trigger.
- Maps: We improved the readability of map objects with status-related background colors.
Server:
- PRTG Core Server: Several performance and stability improvements for the PRTG core server
- Graphs: We updated the engine that PRTG uses to create data graphs. Thanks to the updated graphs engine, stacked graphs look better now!
- Logging: This version includes some more improvements for the logging framework.
Sensors:
- HTTP Push Data Advanced: The HTTP Push Data Advanced now supports UTF-8 characters in the section of received messages and can display, for example, Chinese, Japanese, or Russian characters in the sensor message.
- SNMP Trap Receiver: The SNMP Trap Receiver sensor now supports several modes for bindings that you can use with the syntax bindings[oid,value,mode].
Mode can be:
- substring: This is the default mode that works like bindings[oid,value].
- exact: This mode enforces an exact match of a value.
- equal, greater, greaterorequal, less, lessorequal: This mode compares received numbers with the defined value.
- Windows Updates Status (PowerShell): We changed the approach of the Windows Updates Status (PowerShell) sensor to avoid down states that are not meaningful enough. As of the current PRTG version, the sensor will always create the channel Time since last update. All other channels only show up if the sensor can retrieve according data. Furthermore, the channel value is more accurate now.
Server:
- PRTG Core Server: We fixed an issue with the PRTG core server. In certain cases, the issue lead to access violations in the PRTG server system that could result in issues with sending notifications or unexpected server restarts with sensors in unknown status.
- PRTG GUI Starter: We fixed several issues with the PRTG GUI Starter. It will work more reliable now.
- Security: We fixed a possible XSS vulnerability.
- Server Startup: We fixed an issue with the flowid field in toplists of NetFlow sensors that could result in an exception during the startup of the PRTG server. The PRTG server did not start in such cases.
Sensors:
- Channels:
- You can edit channel names in a sensor's channel settings again (where supported). In previous versions, the Name field in the channel settings often was read-only by mistake.
- If you select the Data option Display in percent of maximum in the settings of a sensor channel, PRTG will now interpret any set Limits as percentage based on the maximum value to avoid false alarms.
- Event Log (Windows API): The Exclude Filter of the Event Log (Windows API) sensor now correctly disregards all events that you have added to the filter, for example, event IDs.
- Flow Sensors: Stability improvements for the sensor types IPFIX, NetFlow V5, NetFlow V9, and sFlow: The fields FlowID, InboundInterface, and OutboundInterface in custom toplists are now stored with their field ID. In previous versions, they were stored as index, which could lead to issues when the list of fields changed.
- Lookups: Lists of lookup files are sorted alphabetically again when you select value lookups for a sensor channel. IDs of lookups are also loaded case insensitively again to prevent issues when you override default lookups with customs lookups.
- Sensor Factory: PRTG correctly calculates historic data of the Sensor Factory sensor again. In the last preview version, live data was used to calculate historic data instead of averages. This resulted in wrong values.
- SNMP Custom String Lookup: We fixed an issue with device templates that include an SNMP Custom String Lookup BETA sensor. When running an auto-discovery with the template, PRTG created an unused channel that was not defined for the sensor.
- SNMP sensors: SNMP sensors that support this functionality now only replace text within square brackets in the sensor name if the text is an OID or a defined variable. All other text will appear in the sensor name as it is.
- SNMP Trap Receiver: The SNMP Trap Receiver sensor now properly handles quotation marks (") in the filter for bindings and can find strings that contain quotation marks.
- UPS Health (Generic) Template: The device template UPS Health (Generic) now also supports Tripp Lite UPS, so running an auto-discovery with the template will create suitable sensors for your Tripp Lite UPS.
- WMI Sensors: You can now add the sensor types Windows Physical Disk I/O, WMI Exchange Server, WMI Exchange Transport Queue, WMI Logical Disk I/O, and WMI Vital System Data (V2) using the auto-discovery. The auto-discovery could not successfully add these sensor types in previous versions.
v18.2.41.1652 [Apr 13, 2018]
- New SNMP Fujitsu System Health BETA sensor.
- NetFlow, SMB and Channel-naming Improvements.
- More Visibility, Less Deletion.
v8.4.2.2380 [Apr 19, 2011]
Bugfix: [Web Server] Fixed potential XSS vulnerability
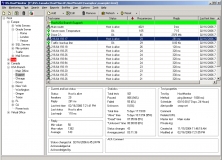
Allows you to easily manage security on company network from a single location.